Aplicativo GNUPLOT / GNUPLOT software
Comandos básicos, tutorial e exemplos de aplicação
Basic commands, tutorial, and application examples


Página inicial / Home
Página Oficial (www.gnuplot.info)
Instruções iniciais
Tutorial
Exemplos: 1, 2, 3, 4, 5, 6.
Download


EXEMPLOS DE GRÁFICOS DE BARRAS
(dados lidos em arquivo)
Exemplos - Página 5

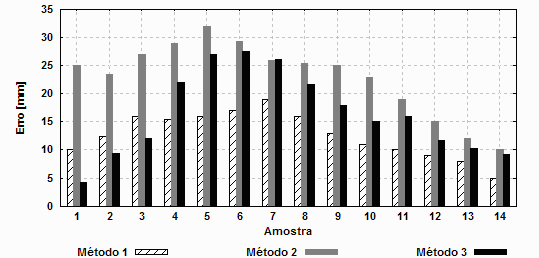
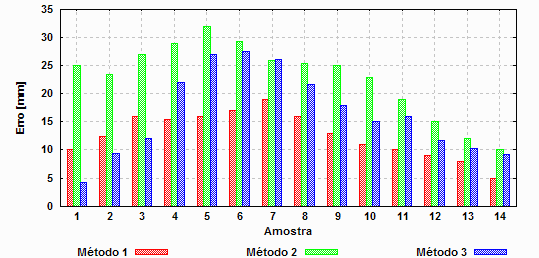
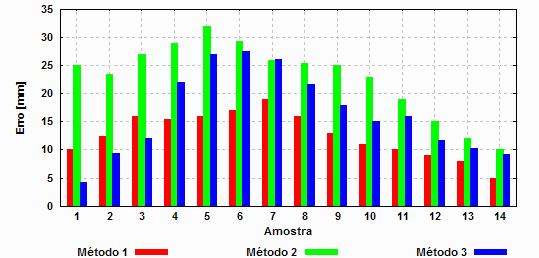
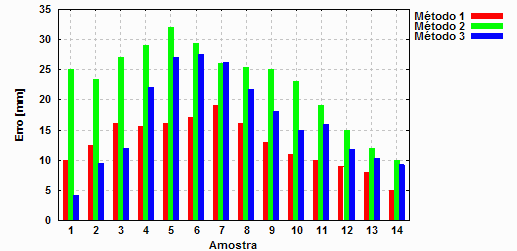
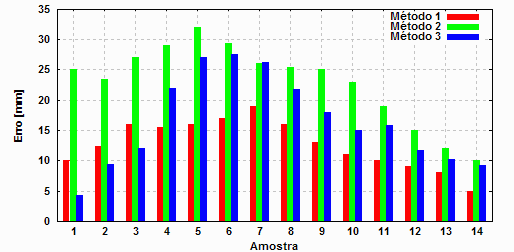
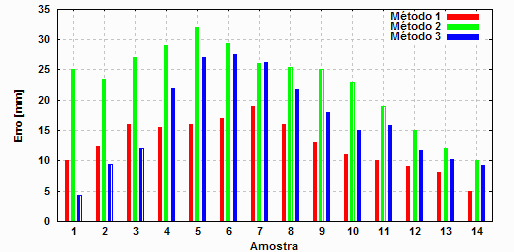
Nesta página são mostrados alguns exemplos de gráficos de barras, gerados com o gnuplot. Os dados são lidos no arquivo BARRA.TXT (compactado no arquivo barra.zip).

Atenção: Dependendo das configurações do seu sistema, algumas cores poderão ser diferentes das cores mostradas nesta página.

Exemplo - Gráfico de barras - Modelo 1.

# ---------------------------------------------------
# Gráfico de barras construído com o Gnuplot (Mod. 1)
# Autor: M. Galo, UNESP / Dep. de Cartografia
# 2007, 2016
#
unset mouse
reset
set grid
set xrange [0.5:14.5]
set xtics 1
set xlabel "Amostra"
set ylabel "Erro [mm]"
set boxwidth 0.2 relative
set style fill solid 0.5
set key outside below
plot "barra.txt" using ($1-0.2):($2) t"Método 1" with boxes fill pattern 5 lc 8
rep "barra.txt" using ($1 ):($3) t"Método 2" with boxes fill pattern 3 lc 9
rep "barra.txt" using ($1+0.2):($4) t"Método 3" with boxes fill pattern 3 lc 8
pause -1 "Fechar?"


Exemplo - Gráfico de barras - Modelo 2.

# ---------------------------------------------------
# Gráfico de barras construído com o Gnuplot (Mod. 2)
# Autor: M. Galo, UNESP / Dep. de Cartografia
# 2007, 2016
#
unset mouse
reset
set grid
set xrange [0.5:14.5]
set xtics 1
set xlabel "Amostra"
set ylabel "Erro [mm]"
set boxwidth 0.2 relative
set style fill solid 0.5
set key outside below
plot "barra.txt" using ($1-0.2):($2) t"Método 1" with boxes
rep "barra.txt" using ($1 ):($3) t"Método 2" with boxes
rep "barra.txt" using ($1+0.2):($4) t"Método 3" with boxes
pause -1 "Fechar?"


Exemplo - Gráfico de barras - Modelo 3.

# ---------------------------------------------------
# Gráfico de barras construído com o Gnuplot (Mod. 3)
# Autor: M. Galo, UNESP / Dep. de Cartografia
# 2007, 2016
#
unset mouse
reset
set grid
set xrange [0.5:14.5]
set xtics 1
set xlabel "Amostra"
set ylabel "Erro [mm]"
set boxwidth 0.2 relative
set style fill solid 0.5
set key outside below
plot "barra.txt" using ($1-0.2):($2) t"Método 1" with boxes fill pattern 3 lc 1
rep "barra.txt" using ($1 ):($3) t"Método 2" with boxes fill pattern 3 lc 2
rep "barra.txt" using ($1+0.2):($4) t"Método 3" with boxes fill pattern 3 lc 3
pause -1 "Fechar?"


Exemplo - Gráfico de barras - Modelo 4.

# ---------------------------------------------------
# Gráfico de barras construído com o Gnuplot (Mod. 4)
# Autor: M. Galo, UNESP / Dep. de Cartografia
# 2007, 2016
#
unset mouse
reset
set grid
set xrange [0.5:14.5]
set xtics 1
set xlabel "Amostra"
set ylabel "Erro [mm]"
set boxwidth 0.2 relative
set style fill solid 0.5
set key outside
plot "barra.txt" using ($1-0.2):($2) t"Método 1" with boxes fill pattern 3 lc 1
rep "barra.txt" using ($1 ):($3) t"Método 2" with boxes fill pattern 3 lc 2
rep "barra.txt" using ($1+0.2):($4) t"Método 3" with boxes fill pattern 3 lc 3
pause -1 "Fechar?"


Exemplo - Gráfico de barras - Modelo 5.

# ---------------------------------------------------
# Gráfico de barras construído com o Gnuplot (Mod. 5)
# Autor: M. Galo, UNESP / Dep. de Cartografia
# 2007, 2016
#
unset mouse
reset
set grid
set xrange [0.5:14.5]
set xtics 1
set xlabel "Amostra"
set ylabel "Erro [mm]"
set boxwidth 0.2 relative
set style fill solid 0.5
set key right
plot "barra.txt" using ($1-0.2):($2) t"Método 1" with boxes fill pattern 3 lc 1
rep "barra.txt" using ($1 ):($3) t"Método 2" with boxes fill pattern 3 lc 2
rep "barra.txt" using ($1+0.2):($4) t"Método 3" with boxes fill pattern 3 lc 3
pause -1 "Fechar?"


Exemplo - Gráfico de barras - Modelo 6.

# ---------------------------------------------------
# Gráfico de barras construído com o Gnuplot (Mod. 6)
# Autor: M. Galo, UNESP / Dep. de Cartografia
# 2007, 2016
#
unset mouse
reset
set grid
set xrange [0.5:14.5]
set xtics 1
set xlabel "Amostra"
set ylabel "Erro [mm]"
set boxwidth 0.1 relative
set style fill solid 0.5
set key right
plot "barra.txt" using ($1-0.2):($2) t"Método 1" with boxes fill pattern 3 lc 1
rep "barra.txt" using ($1 ):($3) t"Método 2" with boxes fill pattern 3 lc 2
rep "barra.txt" using ($1+0.2):($4) t"Método 3" with boxes fill pattern 3 lc 3
pause -1 "Fechar?"

Autor: Mauricio Galo, UNESP, Departamento de Cartografia
Presidente Prudente - SP